Planning October 2020
The Art of Learning by Example
Planning for a future when computers can see: practical intersections of planning practice and AI.
By David Wasserman, AICP
From sidewalk inventories to travel surveys, planners devote considerable time and energy to understanding existing conditions. It doesn't have to be that way. With the help of artificial intelligence, planners can now evaluate the potential impact of a safety project in one week rather than having to wait five years, or pull off a sidewalk inventory across an entire county in a matter of weeks rather than months.
While there's no replacement for being physically in the communities we serve, I think we can all agree that standing in parking lots counting cars isn't the best use of our time. So put away the clipboard and see how recent advances in AI — and particularly its computer-vision subfield — promise to refocus planners' efforts on the work only we can do and revolutionize how we understand our communities.
The term "artificial intelligence," or AI, often conjures images of autonomous vehicles meandering through streets, smartphone assistants answering questions, or even androids exploring final frontiers. While some might think that touches on the realm of science fiction, in some ways, the reality of AI today isn't that far off.
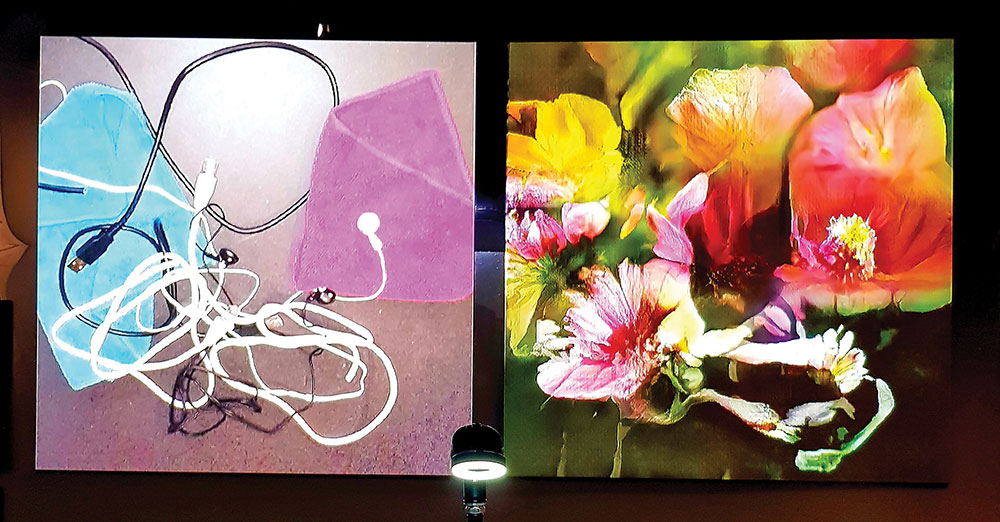
Artist Memo Akten illustrates how computer vision algorithms can only interpret the world based on what they have been trained to see before — in this case, everything is flowers. From Learning to See (2017), part of the Barbican's More Than Human Exhibit (2019). Photo courtesy the artist.
AI is the study of algorithms that can sense, reason, adapt, or otherwise simulate human intelligence. It has had stops and starts since the late 1950s, but everything changed in the early 2010s. The field experienced a renaissance fueled by improved hardware, the advent of big data, and the widespread use of deep learning (a generalized set of algorithms loosely inspired by neurons in the brain). Combined, these advances enabled computers to learn by example, which has quietly allowed them to do all sorts of new tasks, from translating speech and increasing the pace of industrial automation to identifying cat pictures on the internet.
Computer vision, a rapidly growing area of AI dedicated to creating insights from images, has significant implications for the future of planning.
We are entering an age where machine models can use a real-time camera to determine if a bike lane is blocked by a truck, extract sidewalk data from the mass of inputs delivered by aerial images, and count users of an intersection over time without a person expending any time at all.
Because of its complexity and constant evolution, it is impossible to identify a comprehensive list of ways computer vision might influence planning practice. And it needs to be said — early and often — that the benefits of artificial intelligence don't come without very real unintended consequences to individuals and society, as well as opportunities for some to cause intentional harm. Planners must educate themselves on, and advocate for, ways to minimize and mitigate those downsides — from racial and gender bias to data breaches and more.
This article will delve into that in detail later, but let's start with three current applications of computer vision that can most facilitate better planning and design: digitizing the built environment at scale, reimagining urban observation, and empirically evaluating the impacts of changes to the built environment.
As you read, you'll notice that many applications of AI mentioned involve services offered by vendors and start-ups bringing these technologies to market. That is inevitable, as advancements and applications of AI are currently being led by the private sector. But planners still have a massive stake and role to play, both in leveraging the opportunities AI has to offer as well as mitigating challenges that come along with it.
Defining Intelligent Systems
Machine learning and deep learning are subfields of artificial intelligence. The emerging field of deep learning is powering the latest advances in intelligence, such as self-driving vehicles.
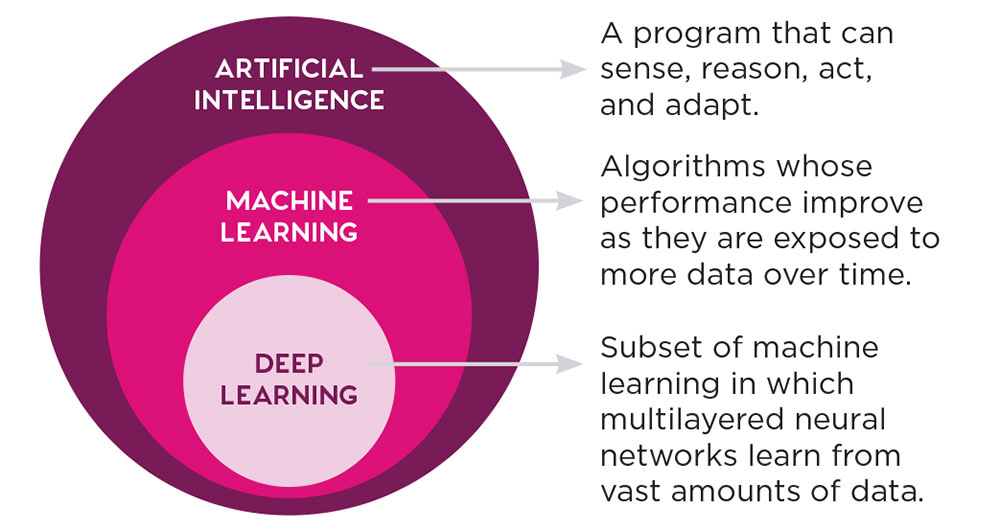
Source: Towards Data Science
Digitizing the built environment
Planners typically inventory the built environment with parcel data, Google Earth, and/or an army of interns. Today, computer vision can transform imagery directly into geospatial data, which can reduce costs and potential errors common in the tedious work traditionally required to digitize community assets.
Take multimodal planning to improve pedestrian connectivity, which the Southeast Michigan Council of Governments' (SEMCOG) Bike and Pedestrian program recently engaged in across its seven-county region. Typically, SEMCOG, and agencies like it, rely on manual techniques such as field work or manual review of aerial or on-street imagery to populate sidewalk or crosswalk databases that allow them to develop scalable insights.
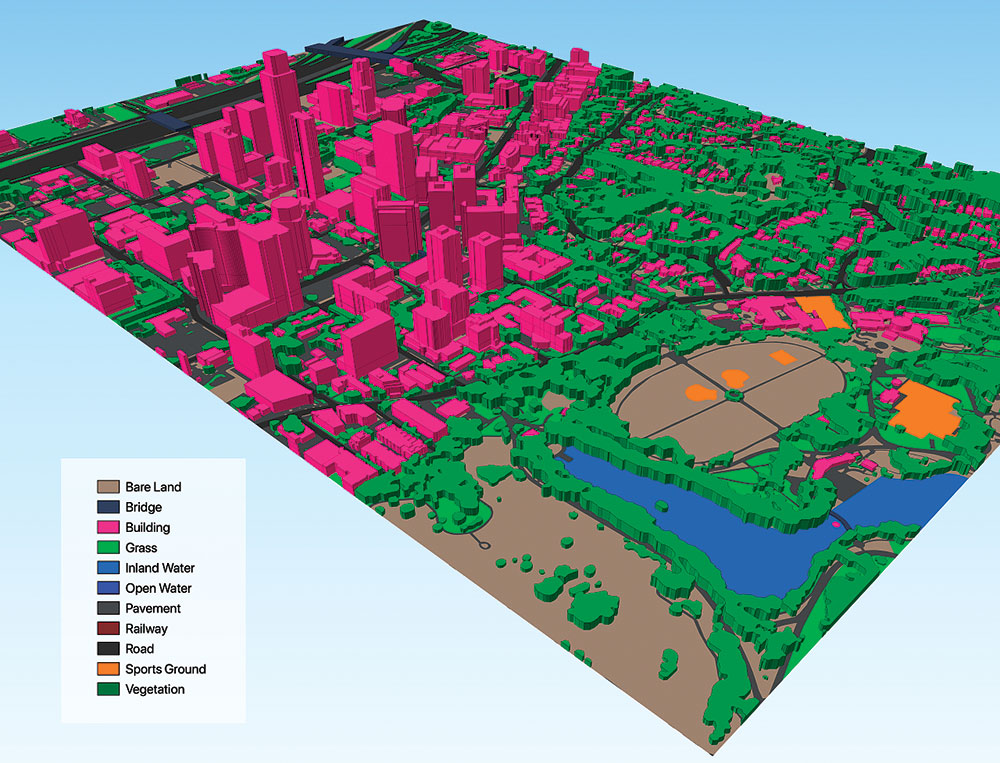
Instead, the SEMCOG Bike and Pedestrian program, seeking to understand gaps in their pedestrian infrastructure, turned to vendor Ecopia, whose AI digitization process can identify sidewalks and crosswalks (as well as roadbeds, trees, building footprints, and other aspects of the built environment) from high-resolution aerial imagery. The result was a database of more than 24,000 miles of sidewalks and 160,000 crosswalks delivered to the agency at a fraction of a traditional survey's cost.
"Having this data allows us to understand where in the region residents have limited access to sidewalks, as well as where crosswalks may need to be enhanced to improve safety," says Kathleen Lomako, AICP, the executive director of SEMCOG. "This allows us to work with local communities to address gaps and strategically plan for infrastructure, especially for those households without easy access to a sidewalk."
AI applications work with street-level imagery, too. A mobile app called Mapillary captures sequences of geotagged images through community crowdsourcing, and leverages computer vision to map street signs, traffic lights, and other on-street elements.
Fehr & Peers, the transportation consulting firm I work for, has found Mapillary to be a useful complement to quality control inventories. During field work, planners mount smartphones to a vehicle's dashboard. The app takes photos every three seconds, and then they are mapped when uploaded to Mapillary's servers. After a few days, these contributed photos are processed, and every sign, crosswalk, or other feature Mapillary can detect is extracted. Afterward, both the images and their extractions can be used to contribute to OpenStreetMap.
And fortunately, since its acquisition by Facebook, much of Mapillary's commercial platform and data are free.
Digitizing the Built Environment
Starting with high-resolution aerial images, AI digitization inventoried a region's sidewalks and crosswalks.
Creating Inventory
The Southeast Michigan Council of Governments worked with Ecopia to conduct a regional sidewalk and crosswalk inventory at a price point, timeline, and scale not previously possible. SEMCOG was able to map and analyze more than 24,000 miles of sidewalks and 160,000 crosswalks throughout its seven-county region, discovering that 23 percent of the region's crosswalks are marked and that 76 percent of the population is within 100 feet of the nearest sidewalk. The information was then used to help create a mobility plan.
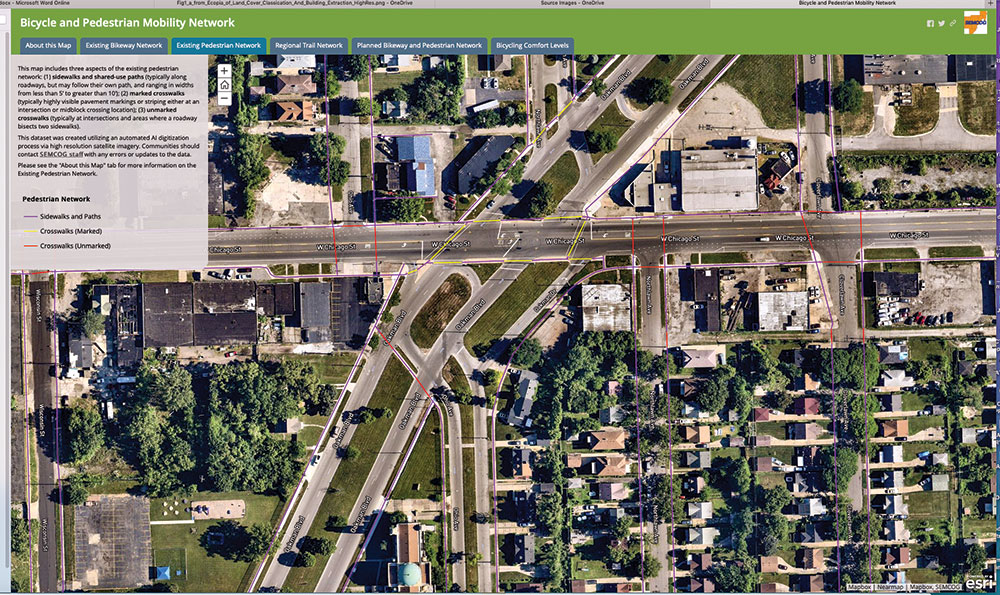
SEMCOG
Crowdsourcing
Mapillary captures sequences of geotagged images through community crowdsourcing, and leverages computer vision to map street signs, traffic lights, and other on-street elements. Fehr & Peers used Mapillary to assist with verifying a crosswalk inventory created by Ecopia in King City, California, as part of a systemic safety project. This screenshot shows detected stop signs. Individual images can be revisited after fieldwork is completed.
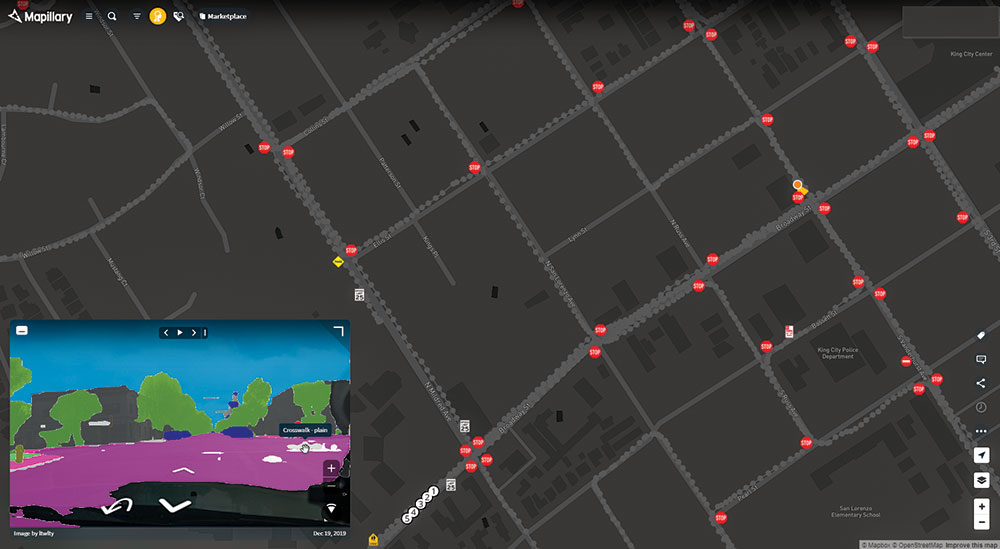
Image created by David Wasserman.
Feature Extraction
Ecopia's Global Feature Extraction service can extract roads, sidewalks, 3-D buildings, and more than 12 different land features from a variety of imagery that can then be used in high-definition vector maps.
Courtesy Ecopia.
Reimagining urban observation
William Whyte's observations of New York plazas in the 1980s, documented in the Social Life of Small Urban Spaces, were revolutionary in grounding principles of urban design. But to get them, Whyte had to comb through reams of interviews, video review, and time-lapse photos to study how people used public spaces. Today, such a study could be replicated affordably and at much more massive scale.
Across the U.S., companies such as Numina, MicroTraffic, and Transoft Solutions (previously Brisk Synergies) use computer vision to inform safety studies, identify how people use public spaces, and observe multimodal behavior. These technologies are already transforming systemic traffic safety studies, which have traditionally relied heavily on long-running collision histories.
Take Bellevue, Washington. The city needed to conduct a safety study as part of their Vision Zero efforts (see sidebar). Bellevue planners didn't want to wait years for patterns to emerge from actual collisions, so they worked with Transoft Solutions to automatically analyze 5,000 hours of footage from 40 existing HD traffic cams, and identified nearly 20,000 "near misses" among pedestrians, cyclists, cars, buses, and other road users — data that could previously only be identified from qualitative and manual review of video footage of an intersection.
Typically, such an effort would have taken "five-plus years for a pattern to emerge," says Franz Loewenherz, principal transportation planner for Bellevue. With near-miss data, "we were able to compress five years into one week," he adds, noting the city could quickly identify high-risk intersections and prioritize countermeasures to help prevent collisions altogether — including the ones it would have taken to build a traditional collision dataset.
Cities are also taking AI to the skies and automating parking surveys with drones Holland, Michigan, is one example. (Read about drones and planning in Planning's November issue.) In July 2019, the city was contending with stakeholders' perceptions of undersupplied parking in their downtown during the annual summer influx of tourists that could overwhelm capacity. They wanted to better understand their parking needs, but parking surveys are typically expensive and require in-person fieldwork.
Instead, they used Quantifly, a startup, to conduct their parking survey via drone, which collected twelve hours of continuous still aerial imagery over 62 acres. Quantifly then processed hundreds of images through a proprietary algorithm to extract downtown occupancy data and delivered final key results to the city just four weeks after the flight.
"I was impressed with the amount of data collected and how quickly we were able to receive it compared to the costly, time-consuming parking study counts done in the past," says Amy Sasamoto, downtown development coordinator for the city. "The data gave us clear ideas of where parking is 'tight' as well as where underutilized on- and offstreet parking is available."
Comparing Quantifly's approach to traditional parking study methods, Adrianna Jordan, AICP, cofounder and manager of Quantifly, said in a email, "This was a pilot project; however, the market rate value of the project was $7,200. Performing the same study manually would likely have cost double that amount and taken twice as long to complete."
Finally, applying real-time computer vision to help planners monitor the curb can eliminate reliance on pricey in-road sensors, such as those pioneered with San Francisco's SFPark program. Start-ups like VADE and Automotus use only a few cameras and achieve similar results by delivering real-time data feeds of on-street parking occupancy, which allow cities to cheaply pilot dynamic parking programs and better manage the curb.
Reimagining Urban Observation
Computer vision helped Bellevue, Washington, perform an innovative safety study to meet its Vision Zero goals.
In 2019, Bellevue, Washington, partnered with Together for Safer Roads and Transoft Solutions Inc. (formerly Brisk Synergies) to conduct a network-wide traffic conflict screening to gain a better understanding of the factors that impact the safety of its transportation system. The project used computer vision and AI to analyze video footage from existing traffic cameras at 40 high-risk intersections and obtain new data and insights on traveler behavior and near misses.
Statistical Approach
The study used a linear regression model to perform a network-wide analysis. Driver speed and post-encroachment time (PET) — represented by y, in the formula below — were the two surrogate safety measures analyzed. Multiple explanatory variables (x) were considered, including traffic volume, peak hour, time of day, day of the week, speed limit, road user type, and road user movement.

Intersection Analysis
The study also analyzed three individual intersections, including 124th Avenue NE and NE 8th Street (below). Visualizations of data gathered revealed more conflicts occurred in areas with lower PET (indicated by yellow and orange dots in map on far right), which were primarily located in front of left-turn lanes. To reduce these conflicts, the city changed the intersection's signalization from permissive left-turn signal phase to protected permissive left-turn signal phase.
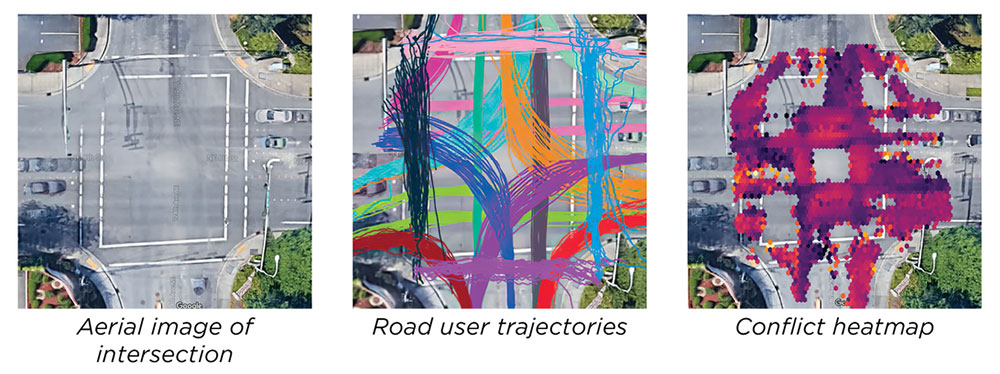
From left, aerial image of intersection, road user trajectories, and conflict heatmap. All images courtesy Transoft Solutions.
Before and After Study
The signalization intervention at 124th Avenue NE and NE 8th Street has proven effective. Follow-up data shows the frequency of lower-PET conflicts for northbound through southbound left-turning vehicles was reduced by 65 percent.
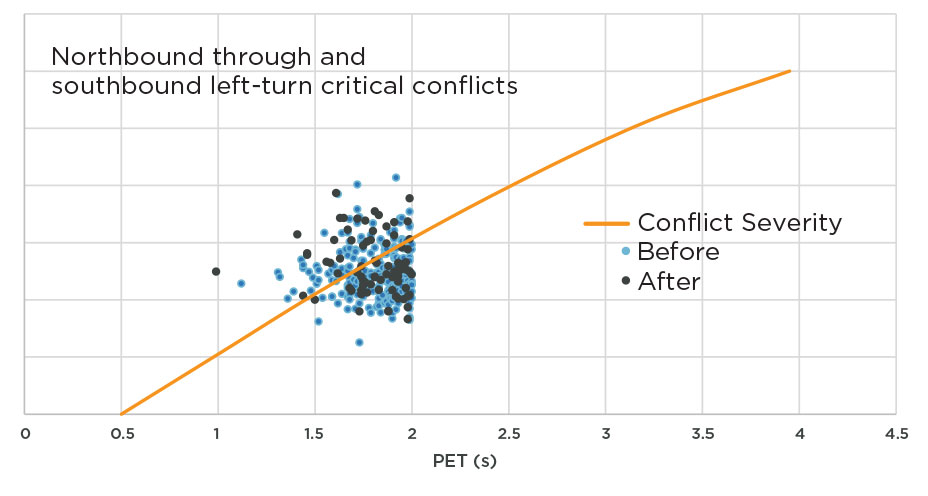
Source: Video-Based Network-Wide Conflict Analysis to Support Vision Zero in Bellevue (WA) United States, July 2020.
Lessons Learned
Due to the sheer amount of data, video processing was lengthy and costly. To reduce cost and time, fewer hours of footage can be processed. Quality of video footage is extremely important; poor or inconsistent footage can result in missed or false data. Similar future projects will place greater emphasis on site selection based on camera field of view and weather conditions.
Working toward testable urbanism
Computer vision can enable us to concretely measure changes to the built environment. Turning digital observations into continuous metrics can enable performance-based practice: every change can generate quantitative before-and-after metrics. Measuring the success of tactical changes to the built environment typically requires significant time and resources, but AI and computer vision can give planners the ability to scale observation at a low cost.
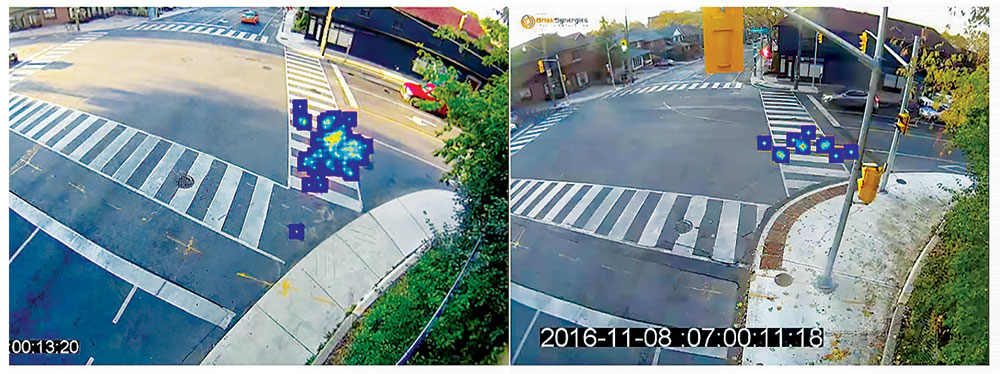
In Toronto, planners turned to computer vision to help them understand how altering the curb radius at an intersection affected turning speeds and near-miss rates. Based on three days of digital observation before and after the concrete was poured, they found that widening the curb caused near-miss rates to drop by 72 percent in low-risk interactions, and 38 percent and 30 percent in moderate- and high-risk near-misses, respectively. They also found that all vehicles involved in a conflict slowed down an average 5.8 percent.
Beyond safety, planners also could use this modeling technology to evaluate other tactical changes to the built environment, such as adding trees, narrowing streets, or constructing parklets. We might even engage with new questions: What urban design features typically increase foot traffic in my community? If a historical plaque is moved to a central part of the plaza, are people more likely to engage with it? And what does that mean for the rest of the street?
The city may never be a true laboratory, but computer vision could provide a new toolkit of low-cost options to hold projects and programs accountable to the goals they set out to achieve.
Testable Urbanism
A new tool to help gauge success.
Testing Challenge
In Toronto, the pedestrian projects team was challenged to measure the effectiveness of an upcoming curb modification. Temporary cameras recorded trajectories and incidents three days before and after the curb radius reduction, tracking conflict rates and the speed of turning vehicles involved in a conflict.
Quick Result Turnaround
Left: conflict hotspots detected before curb radius reduction. Right: conflict hotspots detected after curb radius reduction. Overall, high-risk conflicts decreased by 30 percent from before to after.
Source: Transoft Solutions
A societal mirror
We've barely skimmed the surface of the ways AI could benefit planning. But its potential is as hard to overstate as its risks.
The data that trains these models matters — a lot. Machine-learning algorithms learn patterns from data; so when the data is biased, so are they. Any bias built into these algorithms, even unintentionally, can cause broad societal harm.
In a striking recent example, PULSE — an application intended to improve resolution in facial images — had insufficient diversity in its training data. The resulting algorithm transformed low-resolution images of Black and brown faces into high-resolution images of white ones — a major shortcoming that could result in serious consequences to individuals and society.
This facet is beautifully illustrated by artist Memo Akten, who developed computer-vision models that were only exposed to pictures of fire or flowers as its training data. When shown images of everyday objects, the model interpreted them only as fire or flowers (see photo at top).
Planners have an important stake in eliminating bias in training sets and algorithms, as well as a role to play. And there are other important considerations planners should be aware of to make sure that the use of AI technologies in planning practices results in the best outcomes for everybody.
REPRESENTATION AND BIAS
The largest driver of bias in computer-vision algorithms is representation in the training data used to develop predictive models. Data must include racial and gender diversity.
PRIVACY
As discussed in Planning's "Smart Cities or Surveillance Cities?" transparency to the public about privacy and "smart" technologies is critical. If people feel their privacy is being invaded, support for planning applications of computer vision could diminish.
INTELLECTUAL PROPERTY, OWNERSHIP, AND TRANSPARENCY
In many cases, firms providing AI-derived data or services treat their data and related products as a competitive advantage. This can limit transparency into how the data is derived, and may limit how planners can use the data, particularly if it is licensed rather than owned outright.
NOT URBAN PLANNING SPECIFIC
Many of the advances in computer-vision applications that are of interest to planners have arisen from autonomous vehicle research. As a result, openly available datasets that relate to planning problems such as estimating building setbacks from street-level images are hard to find. We might need to create them.
What's next for planning?
Planners are well situated to articulate AI's role in their practice and their communities. But to do that, we must first seek a seat at the table so that we can represent the best interests of those for whom we plan. For example, "How can we use the ability to observe human behavior, not for mass surveillance, but ... to design environments which are more socially inclusive?" says Dr. Michael Flaxman, geodesign practitioner and spatial data science lead at Omnisci.
With that in mind, here are several things to consider:
ADVOCATE FOR INCLUSIVE ALGORITHMS
Ask pointed questions about bias. Data used to train machine-learning models for a community should reflect the underlying diversity and needs of that community. If we ask the questions, vendors will become more invested in providing answers.
SUPPORT EXPERIMENTATION
Identify and eliminate barriers to entry for procurement contracts. Construct scopes of work for projects and programs that don't exclude start-ups and cutting-edge approaches. Consider pilot projects, internal team trainings, technology exchanges, and "entrepreneur- in-residence" programs.
ADDRESS PRIVACY
Proactively address privacy concerns for any application of computer vision to human behavior. There are legitimate fears that these technologies could take an Orwellian turn if misused, and there are already examples of authoritarian regimes creating integrated surveillance systems to monitor populations at scale.
SOLVE REAL PROBLEMS
Focus on initial applications of technologies that solve targeted and specific problems. AI is often advertised as a one-stop-shop planning solution, but it will not magically remove the politics of planning and, at worst, can become yet another unaccountable black box.
CONSIDER THE REVERSIBILITY PRINCIPLE
To maintain urban resilience, initial applications of AI should be made in investments whose impacts are reversible. This might mean working with subscriptions through vendors and avoiding deep integrations into mission-critical systems.
ACTIVELY DEVELOP TRAINING DATA
Define what should be digitized. It is hard to contemplate now, but data's central role in machine learning can enable planners to build urban planning-specific algorithms. Imagine a future where APA curates opensource image datasets or models that can be shared across communities to solve common problems.
The evolution of the intersection between urban planning and AI is up to us. We must start paying attention now to ensure no one in the communities we serve is left behind.
David Wasserman is a senior transportation planner working at the intersection of urban informatics, 3-D visualization, geospatial analytics, and visual storytelling. His current areas of focus are enabling data-informed scenario planning, incorporating civic data science into planning projects with web-delivery and computer vision derived datasets, and generating accessibility metrics that can identify the possible benefits of projects and who they go to.


